


Today you will…
Learn how to shade linear inequalities so as to find allowable regions and points in two dimensions.
Learners will be used to mathematical versions of games like ‘20 Questions’, where the aim is to identify the object that someone is thinking of. For example, the teacher might say, ‘I’m thinking of a number ...’ and the learners have to find out what the number is. In this lesson, the teacher is thinking of a point, which is represented by a pair of coordinates. This leads to some work on simultaneous linear inequalities.
Starter activity
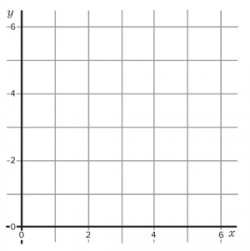
Put the blank grid below on the board.
I’m thinking of a point somewhere on this grid.
Can you work out what it is from the information I am going to give you?
1. The coordinates are integers.
You could check that learners know that integer means ‘whole number’ and that it includes negative whole numbers and zero.
As you give students the three pieces of information below, you could write algebraic versions on the board, or perhaps this would be a good opportunity to see if learners can do so.
2. The y coordinate is bigger than the x coordinate.
y > x
The x and y coordinates add up to less than 6.
x • y < 6
The x coordinate is greater than or equal to 2.
x = 2
Q: Where’s my point?
If they haven’t done this sort of thing before (or even if they have!), learners might write less formally correct versions, such as ‘y = > x’, and you could address this. They might also be unsure whether ‘less than 6’ includes 6 or not. (You could ask, ‘Is 6 less than 6?’) You might choose to use language like ‘at least 2’ for the final statement, which they may find harder to encode into algebra.
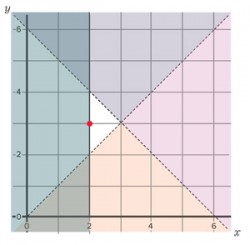
Learners could think about the problem in pairs. Some squared paper would probably help. If they think that they have an answer, you could ask them whether there could be more than one possible answer. In fact, the only possible answer is (2, 3), shown by the red spot in the diagram below, where the parts of the diagram where the point can’t be, have been shaded out. (The solid line x = 2 shows that the point could be on that line, because of the greater-than-or-equal-to symbol above, whereas the dashed lines for the other boundaries are not included in the allowable region, which is why (2, 2), (2, 4) and (3, 3) are not possible answers.)
Q: How do you know that the point I was thinking of had to be (2, 3)?
Main activities
1. Decode another
Q: What puzzle question and answer does the diagram below show?
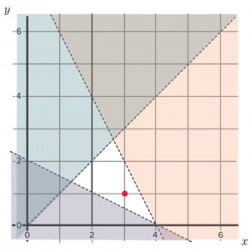
The puzzle here is:
y < x
x • 2y > 4
y < –2x • 8
and the mystery point (red dot) is (3, 1) this time.
Of course, different learners might express the inequalities in equivalent but different algebraic ways, such as
x > y
y > 2 – 0.5x
2x • y < 8
which might lead to some useful discussion.
2. Create your own (same grid)
Q: Make up a mystery point puzzle like this one, using the same zero-tosix-both-ways grid. You have to use three inequality statements and there must be just one possible point as the answer.
Learners could do simpler or more complex ones, according to what they are comfortable with. For example, learners who find this very hard could begin using two lines parallel to the axes and just one oblique one. For instance, suggest:
x > ?
y < ?
x > y
as a pattern and see if they can find suitable integers for the two question marks.
3. Create your own (different grid)
Now the sky is the limit! Learners might decide to allow negative values of x and y, or just change the range from zero-to-six to zero-toten, say, giving lots more possibilities. But there should still be just one integer point solution.
Home learning
A suggested activity for home learning might be:
• Find out about ‘linear programming’ and its uses.
• Try to visualise and describe what would happen if you attempted to do this in three, rather than two, dimensions!
Summary
You could end the lesson with a repetition of the starter task, but harder. For example,
y < 2x
y = 1
2x • y < 8
x < 2y
The solution (1, 1) is shown in the diagram below:
Info bar
Additional resources
A nice interactive website for shading inequalities is http://tinyurl.com/8vjj38h if one learner draws one, can another student identify the inequality represented? Many schools will have autograph (autograph-math.com) or similar software, which will shade inequalities if you enter them algebraically.

Stretch them further
• This is a difficult topic, which will challenge most learners. thinking up situations, such as the following, to fit given inequalities, or solving problems by formulating them in terms of inequalities, can be challenging. for example, I want to buy some cupcakes for a party and I need at least 20 altogether. I want to have at least twice as many vanilla cupcakes as strawberry ones, and I must have at least 6 strawberry ones. If strawberry cupcakes cost £3 and vanilla cupcakes cost £2, what is the cheapest way to do it? What happens if you change the prices of the cupcakes?
(nb the answer is to buy 6 strawberry cupcakes and 14 vanilla ones, which will cost £46)
About the expert
Colin Foster is Senior Research Fellow in the School of Education at the University of Nottingham, and writes books for mathematics teachers www.foster77.co.uk