


Most of what makes classrooms work is invisible. The activities that teachers and students enact are, by and large, irrelevant; the here and now of lessons and classrooms is dependent on the routines and relationships that have been forged over time. If you’re clear about what is and is not acceptable behaviour, firm and fair in applying consequences and provide meaningful feedback on how pupils can improve, it almost doesn’t matter what you do in a lesson. And vice versa: if you neglect these things, no amount of creative and engaging planning will compensate. In a nutshell, if you know your pupils your teaching is likely to be effective. If you don’t, it won’t. But what kind of knowledge are we talking about? It’s all very well forming fantastic relationships with the kids you teach, but if this doesn’t inform their progress then you’re not doing your job. Great teachers will know both the data and the individuals. It’s a professional duty to know where our pupils are, where they should be heading and what they need to do to get there. And hopefully it won’t surprise you to learn that merely slapping a level or grade on the front of exercise books is not good practice. Targets are a fiction in which we collude. What we ponce about blithely referring to as targets are, in fact, statistical likelihoods. They are not predictions and using them, baldly, as targets is potentially harmful. Finding out that a pupil has a B grade target tells us very little. But getting your hands on the full statistical spread of data can be enormously powerful. One tip is to smile winningly at your school’s data manager until he or she provides you with the statistical underpinning of the students’ target grades as supplied by FFT. This shows the statistical likelihood of pupils achieving GCSE results based on their achievement at Key Stage 2: 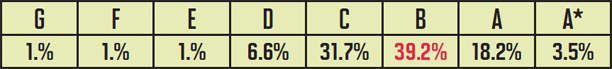 The point is that this is, or can be, highly motivating. The example above shows that while this pupil has a 39.2% chance of getting her B grade target, she has a 60% chance of getting something else. In this case, a C is almost as likely, so there’s no room for complacency. But also, over 20% of pupils with identical attainment at KS2 went on to get an A-A*. Why? Well, of course the reasons will be many and complex but it’s worth having a conversation here about the virtues of hard work, determination and deliberate practice. But what if the data shows something like this?
 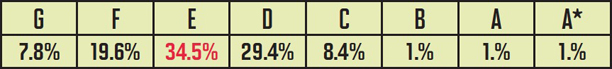 Knowing you’ve only got a 10% chance of getting a C or above might be pretty demotivating. So, what to do? I’ll let you into a little secret: I make it up! In the case above I simply changed the table so that it appeared thus:
 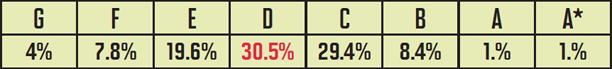 Is this ethical? I’m not sure. But I do know that for this particular student, his chances of beating his E grade target increased dramatically. He now has something to work towards and believe in. He may or may not be one of the 8.4% of children who, despite the low prior attainment end up with a C grade - but I’m absolutely convinced that if we really must damage students by sharing so-called target grades with them, we can at least use them in a motivational way. Another way to use the data available to get to know your students is to place them on a transition matrix:
 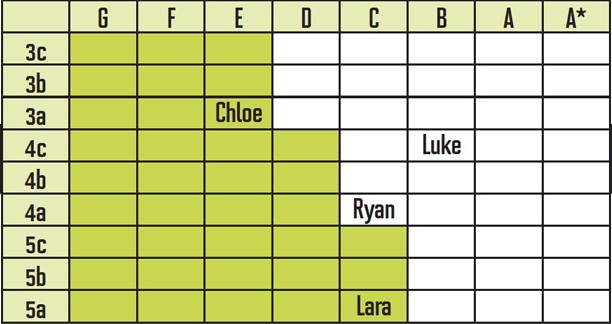 We can use this to work out whether our pupils are on track to make expected progress. As you can see, Chloe and Lara aren’t and Luke and Ryan are. Let’s hear it for the boys! This data is relatively easy to get hold of (just aim another charming grin at your data manager) and going through the process of working out where your pupils are is excellent professional development. But still, this data only gives us part of the picture. Why are Chloe and Lara under-performing? And what can we do about it? Well, our first port of call is more data! Chloe: 90% attendance, FSM Luke: 86% attendance, young carer Ryan: 100% attendance, mild, high performing autism Lara: 76% attendance, G&T, LAC Looking at attendance figures as well as the plethora of information schools hold on their pupils can be jolly useful. Lara, as a looked after child must be a high priority. Clearly her attendance is a major factor in her lack of progress, and, just in case we hadn’t worked it out, she’s bright. So what can we do? We may still feel unsure about how best to proceed with particular pupils but at least we won’t be labouring in ignorance. Plotting pupils onto a transition matrix and then discussing how and why they might be where they are and what can be done about it means we temper the fluff and fancy of our intuition with cold, hard facts. Undertaking this exercise as a department can be a very productive way to spend meeting time. This isn’t a panacea. Obviously, it’s not fool-proof and any attempt to reduced human beings to something so simplistic is fraught with problems, but it’s a damn good start. I’m sure there are other, more creative approaches to inclusion and differentiation out there, but as yet I’ve not become aware of them. In the meantime, this might be a workable solution to really getting to know your pupils.
The point is that this is, or can be, highly motivating. The example above shows that while this pupil has a 39.2% chance of getting her B grade target, she has a 60% chance of getting something else. In this case, a C is almost as likely, so there’s no room for complacency. But also, over 20% of pupils with identical attainment at KS2 went on to get an A-A*. Why? Well, of course the reasons will be many and complex but it’s worth having a conversation here about the virtues of hard work, determination and deliberate practice. But what if the data shows something like this? Knowing you’ve only got a 10% chance of getting a C or above might be pretty demotivating. So, what to do? I’ll let you into a little secret: I make it up! In the case above I simply changed the table so that it appeared thus: Is this ethical? I’m not sure. But I do know that for this particular student, his chances of beating his E grade target increased dramatically. He now has something to work towards and believe in. He may or may not be one of the 8.4% of children who, despite the low prior attainment end up with a C grade - but I’m absolutely convinced that if we really must damage students by sharing so-called target grades with them, we can at least use them in a motivational way. Another way to use the data available to get to know your students is to place them on a transition matrix: We can use this to work out whether our pupils are on track to make expected progress. As you can see, Chloe and Lara aren’t and Luke and Ryan are. Let’s hear it for the boys! This data is relatively easy to get hold of (just aim another charming grin at your data manager) and going through the process of working out where your pupils are is excellent professional development. But still, this data only gives us part of the picture. Why are Chloe and Lara under-performing? And what can we do about it? Well, our first port of call is more data! Chloe: 90% attendance, FSM Luke: 86% attendance, young carer Ryan: 100% attendance, mild, high performing autism Lara: 76% attendance, G&T, LAC Looking at attendance figures as well as the plethora of information schools hold on their pupils can be jolly useful. Lara, as a looked after child must be a high priority. Clearly her attendance is a major factor in her lack of progress, and, just in case we hadn’t worked it out, she’s bright. So what can we do? We may still feel unsure about how best to proceed with particular pupils but at least we won’t be labouring in ignorance. Plotting pupils onto a transition matrix and then discussing how and why they might be where they are and what can be done about it means we temper the fluff and fancy of our intuition with cold, hard facts. Undertaking this exercise as a department can be a very productive way to spend meeting time. This isn’t a panacea. Obviously, it’s not fool-proof and any attempt to reduced human beings to something so simplistic is fraught with problems, but it’s a damn good start. I’m sure there are other, more creative approaches to inclusion and differentiation out there, but as yet I’ve not become aware of them. In the meantime, this might be a workable solution to really getting to know your pupils.